Numbers & audience · YouTube, Instagram, TikTok analytics

Numbers you can verify

All data comes from official analytics, dated and rounded to thousands. This is the page for the media planner: reach, quality of reach, audience and proof by category.

YouTube

42,000+ subscribers · 15.9M views · 267 vlogs · source: YouTube Analytics, 3–4 Sept 2026

YouTube · Channel analytics · source: YouTube Analytics, 3 Sept 2026

Quality of reach, not just quantity

Not just total views — how the audience responds to each video, how long it stays and how active the channel is today.

1.5M views in the last 12 months the channel is active today, not just in the past
13,600 median views per video · last 12 months a typical new video gets 10,000–20,000 views — that is the planning number; the all-time median for 2016–2026 is 30,000, the average 39,500
5.3 min average view duration · last 12 months viewers stay — room for a natural brand integration (all-time: 3.7 min)
≈ 185,000 impressions per video · last 12 months how many times YouTube serves a new video to viewers — a measure of how often the algorithm recommends me
133M video impressions in total all channel impressions from 2016 to today
7 % CTR — clicks per impression the share of people who click when a video is shown (6–8 %) — YouTube cites 2–10 % as the usual range

Views by year

in millions · 2026 until 3 September
  • 2.042017
  • 2.442018
  • 2.452019
  • 1.222020
  • 1.042021
  • 0.682022
  • 1.152023
  • 2.102024
  • 1.582025
  • 1.172026*

Ten years of uninterrupted views — even in the weakest year (2022) more than 680,000. Since 2023 the channel has been growing again.

Methodology and verifiability

All numbers come directly from YouTube Analytics exports (3–4 Sept 2026: all-time, last 365 days and Mar–Dec 2016), the public Instagram profile data (all 852 posts, 7 Sept 2026) and TikTok Analytics. They are rounded to thousands; 267 denotes official vlogs, while views and watch hours include all posts on the channel. Planning numbers (median, view duration, impressions per video) are based on long-form videos published in the last 12 months. On request I provide the data export, YouTube Studio screenshots or live access to the analytics.

YouTube · Audience · YouTube Analytics, last 365 days · 4 Sept 2026

An audience that makes the buying decisions

The audience grew up with me. In 2016 it was teenagers and young adults — today the same people are 25–44, with a job, a family and a TV in the living room. In ten years the age structure has shifted by a whole decade; 59 % of viewers are now 25–44, half are 35–54, gender is almost even.
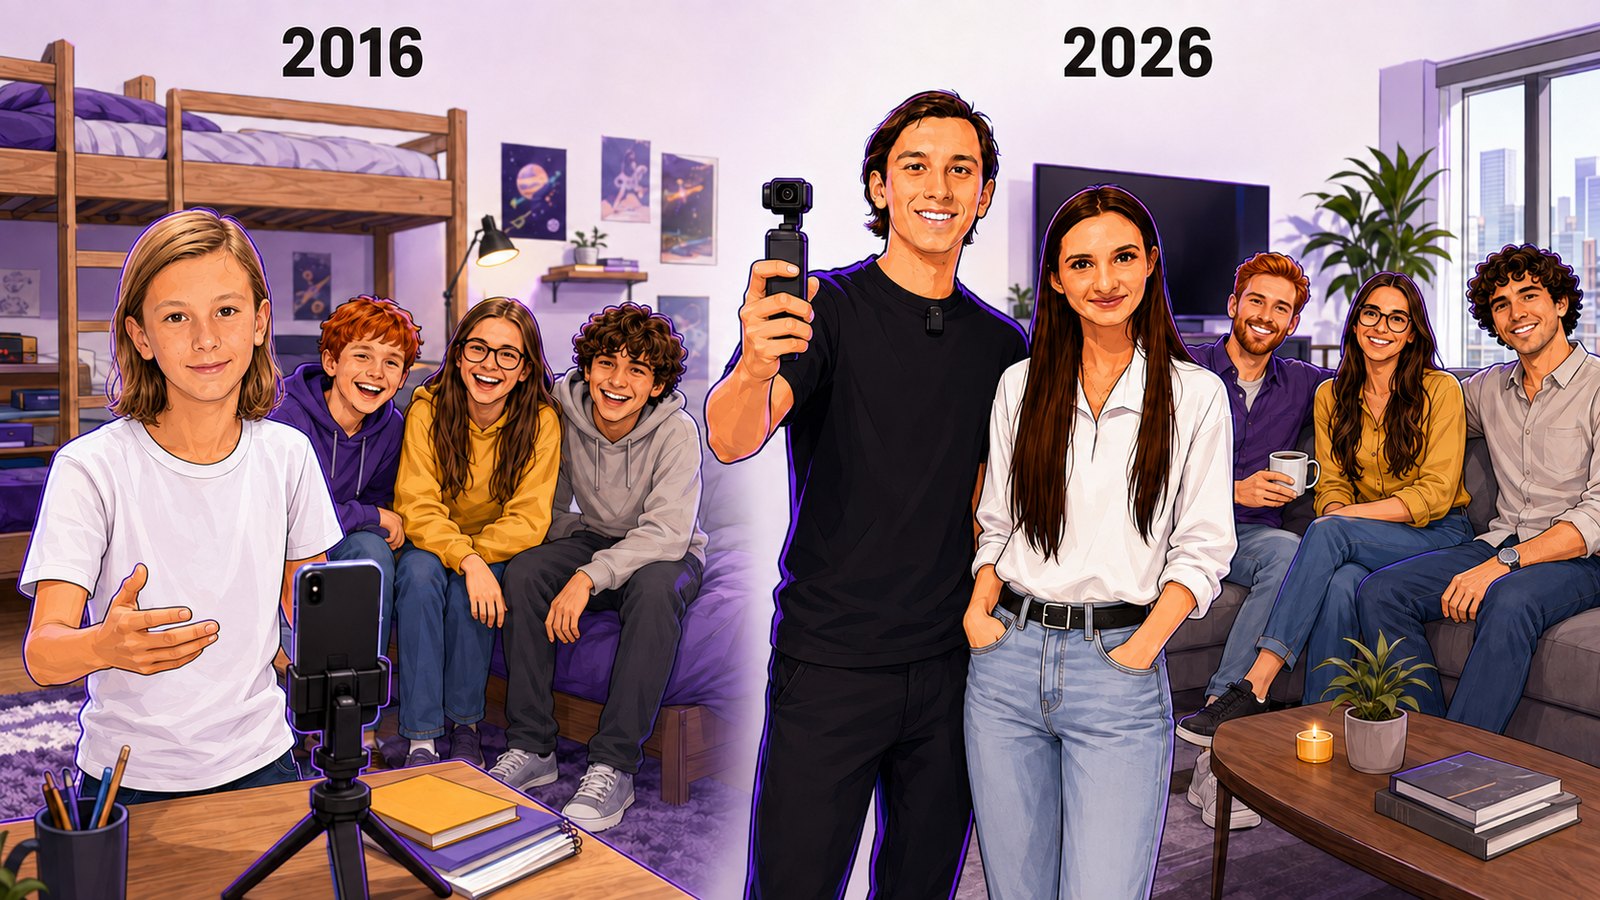
Jack in 2016 in his childhood room with friends and in 2026 in his flat with Anja and the same friends

Viewer age share of views · 365 days

  • 13–179 %
  • 18–2410 %
  • 25–3424 %
  • 35–4435 %
  • 45–5415 %
  • 55–644 %
  • 65+3 %
59 %aged 25–44 · adults with their own budget
50 %aged 35–54 · parents deciding the family budget

Viewer gender

51 % men49 % women

Almost even — a fit for brands that address the whole household, not just one target group.

Where and how they watch

93 %of viewers from Slovenia (2 % Croatia)
53 %of viewing on TV — the living room, full attention
29 %on mobile phones
75 %of watch time from non-subscribers — organic reach beyond the base

Monthly audience last 28 days

46,700viewers in the last 28 days
8,500regular viewers — they come back
17,600new viewers a month
108,000record monthly audience (Jan 2025)

2016 → 2026: the audience grew up with me share of views

Mar–Dec 2016 (start)last 365 days
  • 13–17
    3 %
    9 %
  • 18–24
    27 %
    10 %
  • 25–34
    44 %
    24 %
  • 35–44
    22 %
    35 %
  • 45+
    5 %
    22 %
  • women
    19 %
    49 %
  • on TV
    2 %
    53 %
The same viewers, ten years older
  • 2016: aged 18–24 · 27 %→today: aged 25–34 · 24 %
  • 2016: aged 25–34 · 44 %→today: aged 35–44 · 35 %

The group that was strongest in 2016 is a decade older today — and still watching.

Share of women19 % → 49 %from a boys’ audience to a family one
Viewing on TV2 % → 53 %from the computer to the living room

The age structure has shifted by a decade — from the computer to the living room, from a boys’ audience to a family one. This is loyalty that has matured into purchasing power.

* YouTube reads age from profiles; minors often state a higher age when registering and correct it later. The actual 2016 audience was therefore even younger than the data shows.

YouTube · Most watched

Some of the content that resonated the most

Among the most watched

I’m afraid of horses! — facing a fear, which struck a chord with a huge audience.

Among the most watched

At Edvard and Frida’s — visiting the winners of Slovenia’s Got Talent.

Among the most watched

He deserves a nice Christmas too! — a charity story that resonated far and wide.

YouTube · Proof by category · real views, no paid promotion

Where my content demonstrably works

Every category is backed by videos that passed 100,000 views. If your brand is in one of them, you have proof — not a promise.

📱Technology

  • Introducing the iPhone X207,000
  • Goodbye Apple, hello Huawei159,000
  • Which headphones do YOU use?132,000
  • This is the best hoverboard104,000

🍬Food & beverage

  • How much sugar is in Coca-Cola?131,000
  • Eating one colour for 24 hours114,000
  • Trying Japanese sweets106,000
  • I tried Chinese sweets101,000

🏠Family & lifestyle

  • At Edvard and Frida’s187,000
  • How smart are my dogs?133,000
  • The friend who has to buy you a dog128,000

🎤Events & community

  • Denise Dame is a legend150,000
  • Damjan Murko for president138,000
  • Moments from the Meet & Greet104,000

✈️Travel & experiences

  • Like a 5-star hotel111,000
  • I rode the world’s steepest slide103,000
  • Snowball fight by the pool102,000

💛Social & charity

  • He deserves a nice Christmas too127,000
  • National HPV campaignbillboards

Views from YouTube Analytics, 3 Sept 2026. Detailed audience demographics on request.

Instagram

15,500 followers · 368,000 views / 90 days · source: Instagram Insights, 7 Sept 2026

Instagram · Insights, 7 Sept 2026

Young adults on the phone

74 % of followers are aged 18–34, two thirds male, 95 % from Slovenia. Reels reach 3.7 times more accounts than there are followers — 57 % of views come from non-followers.
368,000views in 90 days130,000 in the last 30 days · 74 % via Reels
58,000accounts reached in 90 days3.7× more than there are followers — 57 % of views from non-followers
391,000views of the most watched Reelin the last 2 years · followed by 89,000 and 60,500
15,500followers95 % from Slovenia · most active in the evening, 6–9 pm
74 %of followers aged 18–3418–24: 39 % · 25–34: 36 % · 35–44: 11 %
66 %male followers34 % women — complements the balanced YouTube audience (51/49)
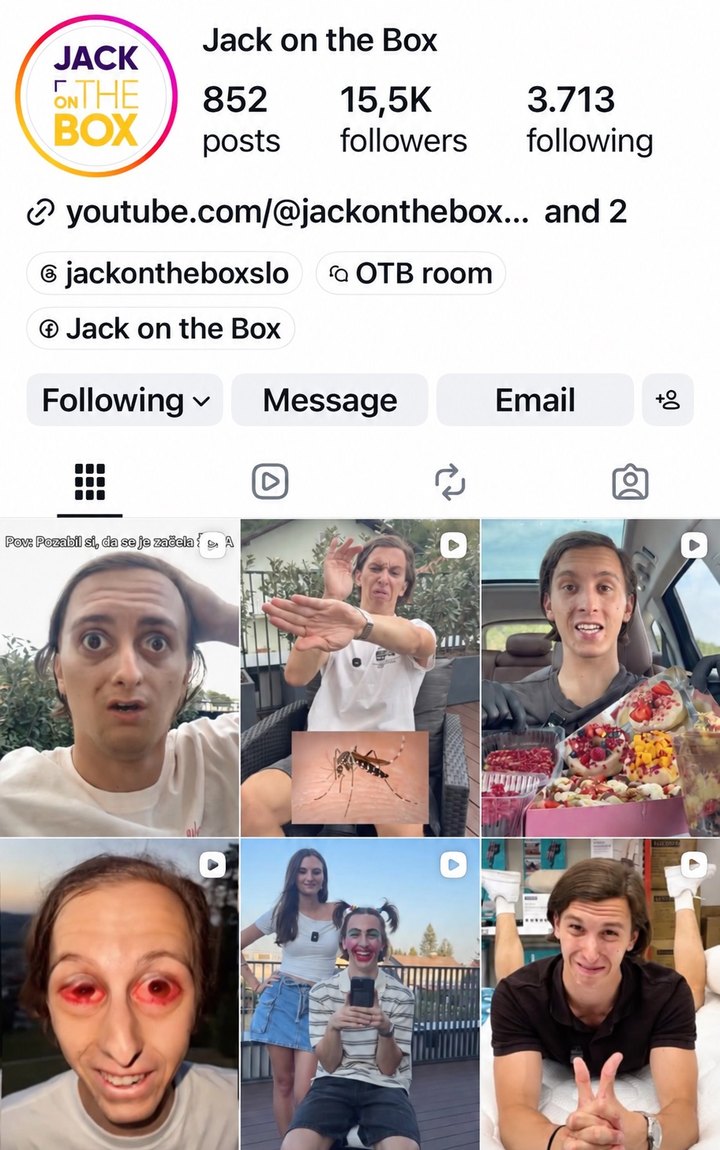
Instagram profile @jackontheboxslo — 852 posts, profile screenshot September 2026
@jackontheboxslo · 852 posts · profile screenshot, September 2026

TikTok

33,200 followers · 8.8M views · source: TikTok Analytics, 7 Sept 2026

TikTok · Analytics, 365 days · 7 Sept 2026

8.8 million views, no video below 10,000

110 videos, 80,000 views per video on average. 84 % of views come from “For You” — the algorithm does the work. The audience is mostly female: the third profile, complementing YouTube and Instagram.
8.8Mviews across all 110 videos80,000 per video on average · none below 10,000
2.5Mviews in the last 365 days1.8M viewers · 657,000 new
84 %of views from “For You”the algorithm pushes the content to new viewers by itself
602,000likes in total148,000 likes and 34,000 shares in 365 days
58 of 110videos above 50,000 views22 above 100,000 · 2 above 700,000
64 %female viewers · among viewers in 365 daysamong 33,200 followers 51 % women and 48 % men — the most female of the three platforms
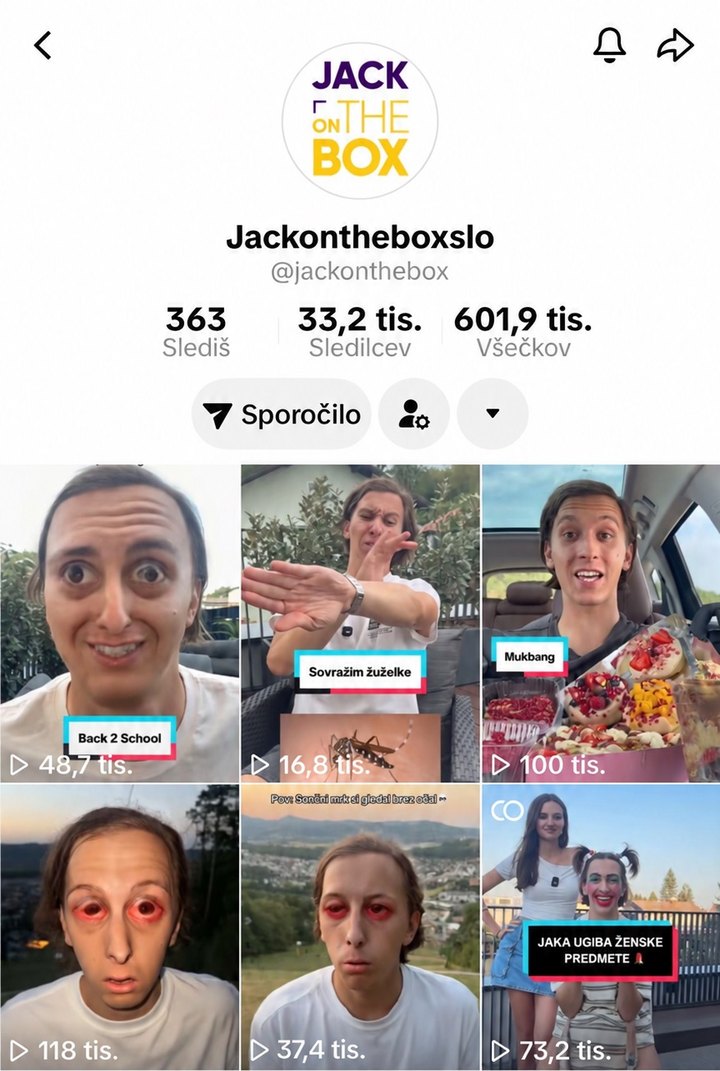
TikTok profile @jackonthebox — 33.2K followers, 601.9K likes
@jackonthebox · 33.2K followers · 602K likes
All three platforms together

Three platforms, three audiences — one campaign covers them all

Adults and families watch YouTube on the TV. Young men follow on Instagram, TikTok is mostly young women — both on the phone. With one creator a brand reaches the whole household.

Jack between three audiences: a family in front of the TV (YouTube), young men on their phones (Instagram), young women in a café (TikTok)
YouTube YouTube Adults & families
  • 59 % aged 25–44
  • gender 51 / 49
  • 53 % of viewing on TV
  • 15.9M views
+
Instagram Instagram Young men
  • 74 % aged 18–34
  • 66 % male
  • on the phone, in the evening
  • 58,000 reach / 90 days
+
TikTok TikTok Young women
  • 64 % female viewers
  • viral reach (For You)
  • 1.8M viewers / year
  • 8.8M views
=
Σ Total The whole household
  • aged 18 to 54
  • both genders
  • TV and phone
  • 24.7M views

Sources: Instagram Insights (Professional dashboard), 7 Sept 2026 — 30- and 90-day periods, most watched Reels over 2 years; TikTok Analytics, 365 days (6 Sept 2025 – 5 Sept 2026). Total TikTok views and the number of videos were counted from the public profile, 7 Sept 2026. Total 24.7M = YouTube 15.9M + TikTok 8.8M.

Ready to write the next chapter together?

A partnership that keeps its word — today, through the season and over the years.